Dirac DevTools FAQ
Why should I use recent Chrome Canary with Dirac DevTools?
Please note that DevTools has two parts.
- DevTools "frontend" is a single-page web application (this is the UI you can see)
- DevTools "backend" is a set of APIs in Chrome providing various services to the DevTools frontend over a websocket connection (see remote debugging protocol).
As you can imagine those APIs are in constant evolution. This is normally not a problem because internal DevTools frontend is bundled with Chrome so it is guaranteed that it talks to a matching backend.
When you use your own version of DevTools frontend and connect it to an arbitrary Chrome (backend) better make sure that the Chrome is of similar "age". It might work but it is not guaranteed. DevTools developers have some anti-fragility system in place which allows detection of available APIs, so that DevTools frontend can adapt dynamically and does not fatally break when used with a slightly different Chrome version. But you should not use "too old" DevTools with "too recent" Chrome and vice versa. Such combinations are not tested and are likely to break because fundamental APIs could be missing / changed on either side.
How do I stick to a particular Dirac version?
Unfortunately it is not easily possible to disable auto-update feature of Chrome Canary. Also it is not easily possible to disable auto-updating of Chrome Extensions installed from Chrome App Store.
But there is a solution. You can use a specific Chromium version and install Dirac extension locally from a zip file.
To make a life easier for you, we auto-generate "Rolling DevTools" section as part of release notes. You can find matching Chromium download links there. And a zip file with extension content is attached as a downloadable file in GitHub releases page.
How do I open Dirac DevTools via a keyboard shortcut?
By default, CMD+SHIFT+I under Mac and CTRL+SHIFT+I under Win.
You can assign a new shortcut via chrome://extensions -> Keyboard shortcuts
How do I focus Dirac REPL prompt via a keyboard shortcut?
It is handy to bind a global keyboard shortcut to focus your Dirac REPL.
You must do this manually via chrome://extensions -> Keyboard shortcuts due to Chrome security reasons.
Ideally (with multi-monitor setup) your always-present Dirac REPL session will be just one keystroke away
from your code editor or any other app.
This is my setup under Mac, note the "Global" selection for "Focus Console Prompt":

Why can't I dock Dirac DevTools inside my Chrome window?
The docking API is only available for the embedded (internal) DevTools that come with Chrome. See the issue #5 for more details.
Does Dirac play well with Figwheel?
Absolutely! Figwheel is fantastic. Just keep in mind that Figwheel's REPL is completely separate from your nREPL connected with Dirac Agent. I usually tend to disable Figwheel's REPL feature in my projects and use Figwheel just as a hot code/css reloader + HUD display for compilation feedback. Figwheel's REPL is an extra feature which is not required for core Figwheel functionality.
Why my project needs working source maps and no optimizations?
Dirac's code completion relies on source maps and the fact that project structure does not get transformed. Dirac can get access to all your namespace source files loaded in the browser and has enough runtime info about the project structure.
My macros are not provided by code completion, what went wrong?
Dirac uses only client-side information to collect code-completion information. It works well with normal namespaces, but macros are fundamentally compile-time thing. Dirac cannot see them unless some information about macros gets "exported" to the client-side somehow.
Good news is that Dirac can read all ns forms in your project (in dev mode with no optimizations and working source maps).
When you mention a macro namespace in a :require-macros of some ns form or reference some symbols from a macro namespace
using :refer or :refer-macros, Dirac is able to understand this and offer such names in code completions.
What is the meaning of colors in code completion suggest boxes?
They should hint additional info about given suggestion. Let's look at some examples:
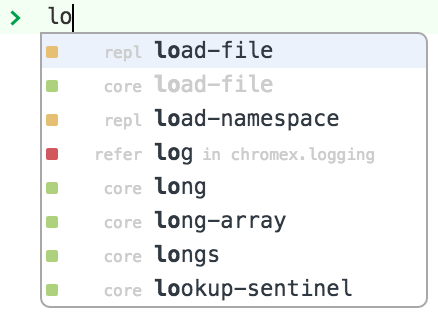 |  |  |
Currently Dirac can display following colors:
- green - cljs namespaces and their content
- red - cljs macro namespaces and their content
- blue - Google Closure namespaces and their content (or any other code participating in Closure modules)
- orange - special REPL commands
Sometimes you can spot combined boxes. For example, red + green means a "combined namespace". It tells you that this name represents both a cljs namespace and a macro namespace.
Gray names are shadowed, meaning that something else with the same name took precedence.
How do you keep Dirac DevTools up to date with official releases?
I have been merging upstream changes pretty frequently. Most merges are without conflicts or with trivial changes, git helps here a lot.
Additionally I maintain a set of automated tests which exercise Dirac features. This allows me to stay pretty confident that nothing broke between updates. For inspiration you can watch this video showing a typical test run (as of Sep-2016).
Something broke! How do I debug Dirac DevTools frontend?
This is not practical because Dirac DevTools code is minified and ClojureScript parts are compiled with :advanced optimizations.
Dirac should display uncaught internal DevTools exceptions in your page's console (since v0.6.1).
This is just for convenience - you get at least some visible feedback about exceptions in the DevTools window.
But still you may want to open the internal DevTools and tinker with the state of Dirac DevTools.
You can open internal DevTools to inspect Dirac DevTools window (e.g. press CMD+OPT+I on a Mac while Dirac DevTools window is focused).
Tip: Also you may want to go to chrome://extensions, open Dirac DevTools options page and set "Open Dirac DevTools" to "as a new window".
This way you can have internal DevTools docked inside Dirac DevTools window which I personally find more convenient.
For more serious debugging you have to setup a dev environment and build a dev version of Dirac Chrome Extension. See hacking.md.
How to enable debug logging in Dirac Agent?
Logging support is not included by default in Dirac library. It would bring in some unwanted dependencies.
But you can install a special version of Dirac library with logging support included:
git clone https://github.com/binaryage/dirac.gitlein install-with-logging
This will install the latest version of Dirac library with logging support into your local Maven repo.
Then you can export an environmental variable controlling logging verbosity in your shell:
export DIRAC_AGENT__LOG_LEVEL=debug (please note the double underscore after DIRAC_AGENT)
And then in the same shell session run your actual repl command, for example lein repl in case of Leiningen. Repl init code
should pickup the custom dirac library if versions match in dependencies.
Is it possible to use Dirac with Node.js projects?
Yes! Please read the documentation here.
How do I reveal source files via nREPL?
DevTools presents file urls in Console and other parts of UI as click-able links. Normally it opens urls in DevTools UI, for example in Sources Panel.
We would like to teach Dirac DevTools to open files in our external editor as well.

This is not an easy task, because
- URLs known to DevTools are typically served by your dev server and mapping to original filesystem files might be unclear, highly dependent on your project configuration.
- ClojureScript generates files and they are served from different place than real location of source files (your compiler copies cljs files into "out" directory in dev mode)
- DevTools app does not have access to filesystem and cannot run shell commands.
- DevTools app might be running remotely.
I decided to implement this using nREPL. When an url link is clicked, Dirac DevTools sends an nREPL message with a request to open url along with line and column information. Dirac middleware running inside nREPL server then decides how to handle it. By default it launches a shell script (if configured).
You can specify nREPL config key :reveal-url-request-handler which is a Clojure function to handle :reveal-url requests. For convenience
I have implemented a default implementation,
which delegates to a shell script specified with :reveal-url-script-path config key (if set).
Please review relevant options in nrepl's config.clj.
Typically you will want to add something like this to your :compiler options:
:external-config {:dirac.runtime/config {:nrepl-config {:reveal-url-script-path "scripts/reveal.sh" }}}
And implement reveal.sh tailored to your project structure using your favourite shell scripting tools.
Please note that this feature was introduced in Dirac 1.2.0 and it works only with a working REPL connection. And you still have to provide a suitable shell script which can do translation between urls and filesystem locations. This script will likely be project-specific. For inspiration, I have implemented an example fuzzy file matching script in dirac-sample project. Please see this commit and this commit how you could potentially implement something like this for your own project.
I have a great idea for contribution! How to hack on Dirac itself?
Please refer to hacking.md.
Can you improve this documentation?Edit on GitHub
cljdoc is a website building & hosting documentation for Clojure/Script libraries
× close