jstack-report



jstack-report turns a jstack thread dump into a one-screen
diagnosis: who is holding the lock that is holding up everyone else,
which clients are stuck on it, and which sections of code are
contributing the longest traces.
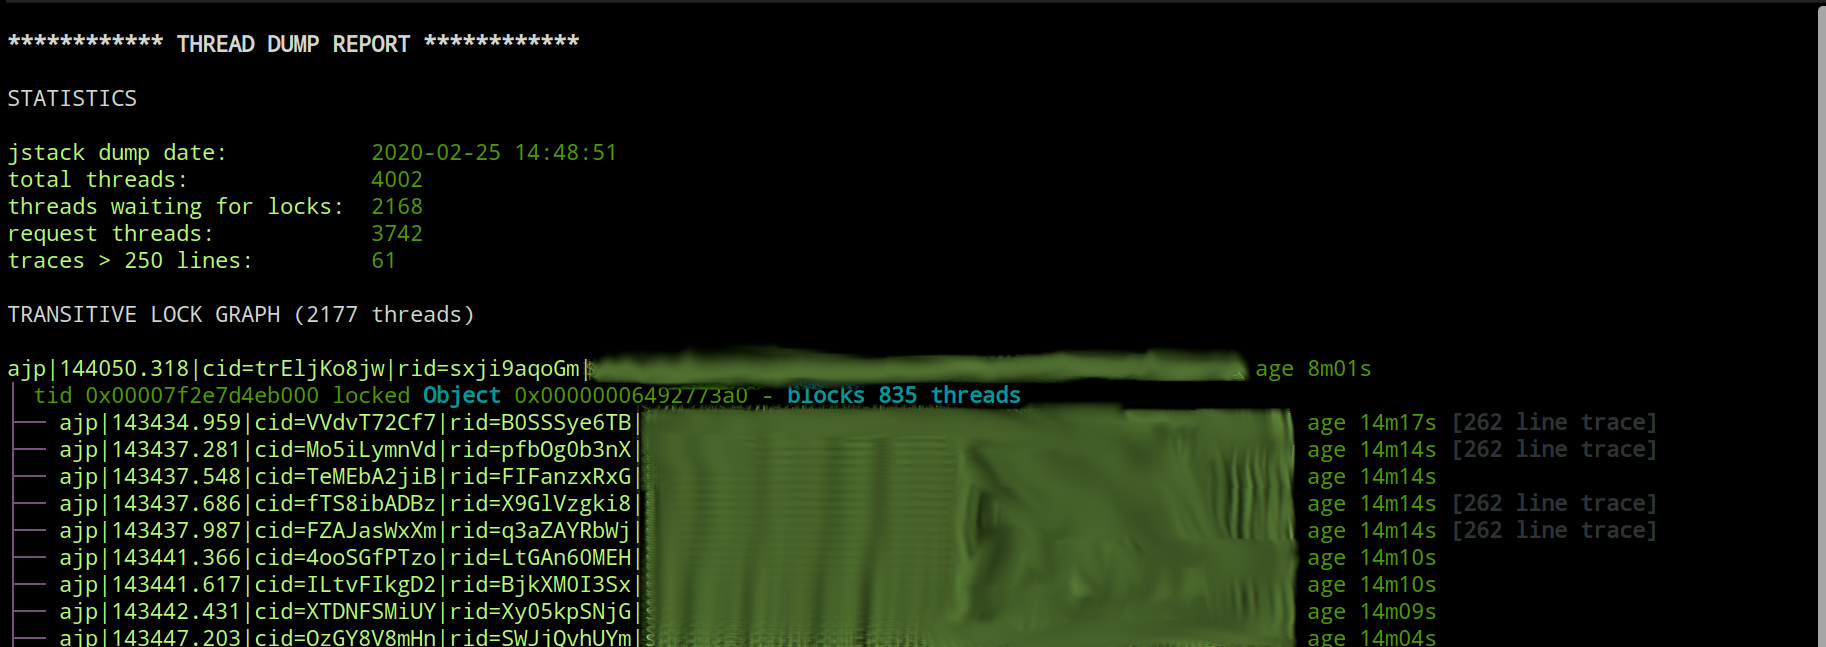
Why?
Long-running JVM server processes — especially complex enterprise stacks glued together from many libraries — occasionally settle into a state where requests pile up faster than they drain. By the time anyone notices, the JVM is half-frozen and the only window you have into it is a thread dump.
Running jstack against that JVM gives you, in the bad cases, a half
million lines of text representing four thousand-plus threads, most of
which are blocked on a lock somewhere. The interesting locks form a
directed acyclic graph; following that graph by hand to its root is
possible but tedious, and you usually have to do it under time
pressure. jstack-report walks the graph for you.
A small example
Say a JVM has four threads:
- thread X holds
ORANGE. - thread A holds
APPLEand is waiting onORANGE. - thread B holds
BANANAand is waiting onAPPLE. - thread C is waiting on
BANANA.
jstack will give you four (possibly long) stack traces, with a few
- locked <...> and - waiting to lock <...> annotations
interleaved. jstack-report renders the same situation as
THREAD DUMP REPORT

⚠ Root blocker: thread-X (tid 0x000000000000000a) blocks 3 other threads
  see TRANSITIVE LOCK GRAPH below

STATISTICS

  jstack dump date            2024-01-15 09:30:45
  total threads               4
  threads waiting for locks   3
  request threads             0
  traces > 250 lines          0

TRANSITIVE LOCK GRAPH · 4 threads

thread-X
│ tid 0x000000000000000a locked Orange 0x0000000000000001 - blocks 3 threads
└── thread-A
    │ tid 0x000000000000000b locked Apple 0x0000000000000002 - blocks 2 threads
    └── thread-B
        │ tid 0x000000000000000c locked Banana 0x0000000000000003 - blocks 1 threads
        └── thread-C
The headline names the root blocker; the tree underneath shows exactly what each intermediate thread is contributing.
Thread naming convention (optional)
jstack-report parses any thread dump, but you get a richer report when threads follow this naming convention:
<ajp|http>|<thread-start-time>|cid=<client-id>|rid=<request-id>|oip=<origin-ip>|<requested-url>
ajp/http— connector type. The original use case ran behind Apache + JBoss, so AJP is overrepresented.httpis fine too.<thread-start-time>—HHmmss.SSS. No date, so jstack-report assumes a thread is at most 24 hours old and infers the day from the dump's wall-clock timestamp.cid=<client-id>— stable per client (sent down as a cookie in the original setup).rid=<request-id>— unique per request.oip=<origin-ip>— optional, the originating IP.<requested-url>— the URL the thread is serving.
The application achieved this by installing a custom thread factory. With the convention in place, jstack-report can answer "which client is hammering us hardest?" and "which URLs are tying up the most threads?" on top of the basic lock-graph view.
Threads that do not match the convention still appear in the report; the request-thread sections simply skip them.
Installation / building
Requires Java (tested against 11, 17, 21) and the Clojure CLI.
clojure -M:test          # run the suite
clojure -T:build uber    # produce the standalone jar
The uberjar lands at target/jstack-report-1.3.1-standalone.jar.
You can also run the tool directly from sources without building, which is handy during development:
clojure -M:run -f <thread-dump.txt>
Running
Two equivalent invocations:
java -jar target/jstack-report-1.3.1-standalone.jar -f <thread-dump.txt>

cat <thread-dump.txt> | java -jar target/jstack-report-1.3.1-standalone.jar
If no -f is given, the tool reads from stdin.
A shell alias makes daily use less verbose:
alias jstack-report='java -jar ~/jstack-report/target/jstack-report-1.3.1-standalone.jar'
jstack-report -f <thread-dump.txt>
Command-line options
Options:
  -f, --file <jstack dump file>  A thread dump file as produced by jstack
  -n, --no-color                 Disable ANSI color in the output
  -h, --help
--no-color is useful when piping into a pager, tee, or anywhere
ANSI escapes would be more annoying than helpful.
What the report contains
| Section | Purpose |
|---|---|
⚠ Root blocker headline | The single highest-leverage finding: the thread at the top of the deepest lock chain, with a count of how many other threads are downstream of it. Replaced by ✓ No transitive lock chains detected when nothing is blocked on a synchronization lock. |
STATISTICS | Dump timestamp, total thread count, count of threads blocked on synchronized, count of request threads, count of traces longer than 250 lines. |
TRANSITIVE LOCK GRAPH | Roots-first tree of every thread that is blocked transitively on another. Each intermediate node carries the lock it holds, the contested oid, and how many threads it is blocking. Per-thread annotations call out [jboss tx reaper thread], [db socketRead0], [db socketRead0 isValid], and [N line trace] for very long traces. |
OLDEST / YOUNGEST REQUEST THREADS | The ten oldest and ten youngest threads that match the request-thread naming convention, by start time. Useful for spotting work that has been waiting too long. |
TOP CLIENT IDS WITH MOST REQUESTS | Clients with more than one in-flight request, sorted by request count. Often a stuck client is retrying or has runaway concurrency. |
TOP THREADS WITH LONGEST TRACES | Outlier stack depth, sometimes a hint at a runaway recursion or a particularly deep call chain. |
TOP REQUESTED URLS | URLs with more than one in-flight thread, sorted by count. |
THREADS WAITING ON DB IN SocketRead0 | Threads blocked inside an Oracle JDBC socketRead0. Annotated [in isValid] when the read is from a CheckValidConnectionSQL.isValidConnection probe rather than a real query. |
Source layout
The codebase is small and divided along data-flow boundaries:
| Namespace | What it does |
|---|---|
jstack-report.parser | Line-based finite state machine. Lines in, structural skeleton out. No knowledge of colors, indexes, or output. |
jstack-report.model | The dump multimethod. Lock/wait reconciliation, request-thread decoration, age computation. |
jstack-report.analyze | Indexes (by-tid, by-oid, waiters-by-*), the transitive lock graph, trace-content predicates (db-socket-read?, tx-reaper?). |
jstack-report.render | Pure presentation: tree rendering with Unicode box-drawing, ANSI styling. Lines out — no I/O. |
jstack-report.report | Section printers, headline, top-level report and jstack-report entry points. |
jstack-report.core | Thin backwards-compatible facade re-exporting dump and report. |
jstack-report.ansi | ANSI escape codes and the *use-ansi* dynamic switch. |
jstack-report.classes | GraalVM reflection configuration; consulted only by the :reflection build profile. |
The dependency edges run cleanly downstream: parser ← model ← analyze ← render ← report.
Programmatic use
jstack-report.model/dump accepts a String path, a File, a
Reader, or a seq/vector of lines and returns the enriched dump map.
From a REPL:
(require '[jstack-report.model :as model]
         '[jstack-report.analyze :as analyze]
         '[jstack-report.report :as report])

(def d (model/dump "/path/to/jstack-dump.txt"))
(analyze/transitive-lock-graph d)   ; the lock graph as nested maps
(report/report d)                    ; the full text report
Tests
The suite under test/jstack_report/ runs against six hand-rolled
synthetic dumps in test/resources/dumps/ covering the FSM happy path,
the README lock chain, the request-thread naming convention, edge
cases (eliminated locks, class for ... forms, notify-wait pairs,
owned ownable synchronizers), a wide root-blocking-many fan-out, and
the trace patterns the socketRead0 and tx-reaper predicates key on.
clojure -M:test
CI runs the same suite across JDK 11, 17, and 21 on every push and PR
to master.
Benchmarking
A phase-by-phase wall-clock benchmark lives at
dev/jstack_report/bench.clj. Useful when you're touching the parser
or analysis hot paths and want to check the impact:
clojure -M:bench <thread-dump.txt> [runs]
The harness warms the JVM once, then reports min/avg/max for each layer of the pipeline (parse, reconcile, indexes, graph, render, report).
License
Author
Matias Bjarland · mbjarland@gmail.com
Can you improve this documentation?Edit on GitHub
cljdoc builds & hosts documentation for Clojure/Script libraries
| Ctrl+k | Jump to recent docs |
| ← | Move to previous article |
| → | Move to next article |
| Ctrl+/ | Jump to the search field |