![]()
![]()

Sayid (siy EED) is an omniscient debugger and profiler for Clojure. It extracts secrets from code at run-time.
Sayid works by intercepting and recording the inputs and outputs of functions. It can even record function calls that occur inside of functions. The user can select which functions to trace. Functions can be selected individually or by namespace. The recorded data can be displayed, queried and profiled.
Sayid currently has three components:
The sayid.core namespace is designed to be used directly via a REPL and does
not require Emacs or CIDER. BUT the CIDER integration offers a far
better experience, so it is the current focus of this page and my
development efforts.
We're looking for more maintainers for the project. If you're interested in helping out please ping @bbatsov.
Why Sayid?
Sayid is an omniscient debugger: you run your code first, at full speed, and explore what happened afterwards. That's a fundamentally different model from the two tools people usually reach for.
Versus clojure.tools.trace. tools.trace prints call/return lines as a side
effect - a wall of text that scrolls past and is gone. Sayid records the same
calls (and, with inner tracing, every intermediate value inside a function)
into a navigable, queryable data structure. You can slice it by function or by
call id, walk into a call's children, or jump to its ancestors. One is
scrollback; the other is a record you can interrogate.
Versus a stepping debugger. A breakpoint debugger asks you to predict where the bug is before you run, stops the world when it hits a breakpoint (rough on concurrency, timing-sensitive code, hot loops, and async callbacks), shows you one stack frame at a time, and forgets everything the moment you continue. Sayid inverts all of that: run first, explore after. The whole execution is already captured, you see the entire call tree at once, and you can revisit any part of it as many times as you like, because it's data, not a paused process.
In short: tools.trace tells you what happened in the order it happened; a debugger lets you watch it happen if you knew where to stand; Sayid hands you the whole execution as data, after the fact, to query however you want.
Installation & Requirements
note
Starting with 0.2.0 Sayid is published under the mx.cider/sayid coordinates.
The old com.billpiel/sayid coordinates are deprecated but still receive the
same releases for now, so existing dependencies keep working. Please switch to
mx.cider/sayid when you get a chance.
Requirements
Basic usage requires Clojure 1.10+ running on Java 8 or newer. The optional nREPL middleware requires nREPL 1.0+, and the Emacs client requires CIDER 1.0+ on Emacs 28+.
(Sayid is tested against Clojure 1.10, 1.11 and 1.12 on a range of JDKs. Older Clojure versions may still work, but they're no longer part of the test matrix.)
nREPL-powered editor plugins are encouraged to make use of the bundled middleware that provides a very flexible Sayid API. Its ops are documented in doc/nrepl-api.md.
Leiningen
Add this to the dependencies in your project.clj or lein profiles.clj:
[mx.cider/sayid "0.4.0"]
To use the bundled nREPL middleware, you'll want to include Sayid as a plug-in. Here's an example of a bare-bones profiles.clj that works for me:
{:user {:plugins [[mx.cider/sayid "0.4.0"]]}}
Clojure CLI - deps.edn
Add a the Sayid dependency to your :deps key. Depending on your
desired setup, you may want to add it to an optional profile, or your
tools.deps config directory (often $HOME/.clojure).
{:deps
  {mx.cider/sayid {:mvn/version "0.4.0"}}}
Emacs Integration
CIDER setup also requires that the Emacs package sayid is installed. It's
available on MELPA and MELPA
Stable. Put this code in init.el, or
somewhere, to load keybindings for clojure-mode buffers.
(with-eval-after-load 'clojure-mode
  (sayid-setup-package))
If you use CIDER's jack-in commands, then Sayid automatically adds the
Maven dependency when starting a REPL. This means you don't need to
manually add the dependency to your project.clj or deps.edn file.
If you don't use CIDER's jack-in commands, you'll need to add a dependency manually. Here's an example of a bare-bones profiles.clj that works for me:
{:user {:plugins [[cider/cider-nrepl "0.59.0"]
                  [mx.cider/sayid "0.4.0"]]
        :dependencies [[nrepl/nrepl "1.3.1"]]}}
Usually you'll want to use the latest versions of cider-nrepl and nREPL here.
Other Editors
A 3rd-party vim plugin also exists. See this and this.
Using Sayid from the REPL
You don't need Emacs or CIDER to use Sayid. The sayid.core
namespace (conventionally aliased to sd) is a complete API on its own. Trace
a namespace or a function, exercise your code, then print the recorded
workspace:
(require '[sayid.core :as sd])

(defn add [a b] (+ a b))
(defn add-twice [a b] (+ (add a b) (add a b)))

;; Trace every function in the current namespace.
(sd/ws-add-trace-ns! user)

(add-twice 3 4)

(sd/ws-print)
That prints the full call tree, including the nested calls to add, with the
arguments and return value of each invocation:
v user/add-twice  :2887
| a => 3
| b => 4
| returns =>  14
|v user/add  :2888
|| a => 3
|| b => 4
|| returned =>  7
|^
|v user/add  :2889
|| a => 3
|| b => 4
|| returned =>  7
|^
| user/add-twice  :2887
| returned =>  14
^
Some other useful entry points:
(sd/ws-add-trace-fn! my-ns/my-fn)traces a single function.(sd/ws-add-inner-trace-fn! my-ns/my-fn)adds an inner trace that also captures every expression evaluated inside the function.(sd/ws-clear-log!)clears the recorded calls without removing the traces.(sd/ws-reset!)removes all traces and clears the log.
Using Sayid
Note: this assumes you're using the official CIDER plugin.
The keybindings are grouped by buffer below. Every list is also available
from within Emacs: press h in any Sayid buffer (or C-c s h in a Clojure
buffer) to pop up the matching help buffer.
API docs for the core namespaces are available on cljdoc.
In a clojure-mode buffer, press C-c s h (sayid-show-help) to
pop up the help buffer.
C-c s f -- Queries the active workspace for entries that most closely match the context of the cursor position
C-c s ! -- Disable traces, load the current buffer, enable traces, and clear the workspace log
C-c s w -- Show the recorded workspace as a navigable, foldable tree
C-c s t y -- Prompts for a dir, recursively traces all ns's in that dir and subdirs
C-c s t p -- Prompts for a pattern (* = wildcard), and applies a trace to all *loaded* ns's whose name matches the pattern
C-c s t b -- Trace the ns in the current buffer
C-c s t e -- Enable the *existing* (if any) trace of the function at point
C-c s t E -- Enable all traces
C-c s t d -- Disable the *existing* (if any) trace of the function at point
C-c s t D -- Disable all traces
C-c s t n -- Apply an inner trace to the symbol at point
C-c s t o -- Apply an outer trace to the symbol at point
C-c s t r -- Remove existing trace from the symbol at point
C-c s t K -- Remove all traces
C-c s c -- Clear the workspace trace log
C-c s x -- Blow away workspace -- traces and logs
C-c s s -- Popup buffer showing what it currently traced
C-c s S -- Popup buffer showing what it currently traced in buffer's ns
C-c s V s -- Set the view
C-c s h -- show this help
The workspace opens in the *sayid-tree* buffer, a foldable tree built on
CIDER's cider-tree-view. Navigation and folding come from there; Sayid adds a
few actions on top:
TAB -- fold or unfold the call at point
RET, . -- jump to the call's source
n, p -- move to the next / previous call
f -- show every recorded call of the function at point (prefix: a modifier)
i -- focus the call at point and its subtree (prefix: ancestors/descendants)
c i -- inspect a captured value in CIDER's inspector (prefix: pick which)
w -- back to the full workspace
q -- quit the window
The older text-rendered view is still available (M-x sayid-get-workspace, and
where the pretty-print and query-at-point commands land); press h in it for its
own keybinding help.
g -- generate instance expression and put in kill ring
h -- help
q -- quit window
C-c s s (sayid-show-traced) shows what's traced as a namespaces to functions
tree in the *sayid-traced* buffer. RET on a function jumps to its source;
TAB folds a namespace, n/p move, q quits.
In the *sayid-pprint* buffer, press h to pop up the help
buffer.
ENTER -- show path in mini-buffer
i -- jump into child node
o -- jump out to parent node
n -- jump to next sibling node
p -- jump to previous sibling node
l -- back to trace buffer
h -- help
q -- quit window
Demos
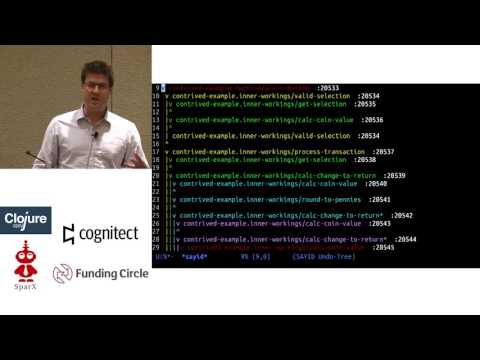
Conj 2016 Presentation
I presented Sayid at the Clojure Conj conference in Austin in 2016.
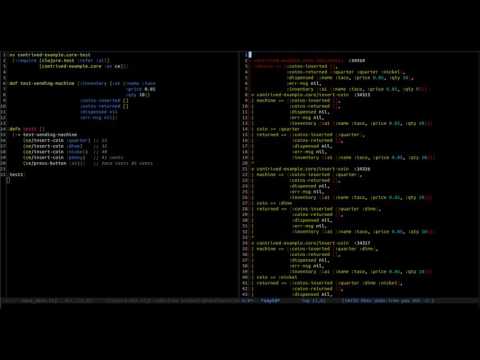
Demo #1 - Video
A demo video I recorded after the very first alpha release. You can find the contrived example project here.
Demo #1 - Walkthrough
Let's hunt a bug with Sayid. Drop this namespace into a file and open it in Emacs:
(ns demo.coins)

(def coin-values
  {:quarter 25
   :dime 10
   :nickel 5
   :penny 5})

(defn total-cents
  [coins]
  (->> coins
       (map coin-values)
       (apply +)))

(defn can-afford?
  [coins price]
  (>= (total-cents coins) price))
It adds up a handful of coins and checks whether they cover a price. There's a bug in here; see if you can spot it before Sayid does.
Load the buffer with C-c C-k (cider-load-buffer), then trace its namespace
with C-c s t b (sayid-trace-ns-in-file).
Now exercise the code from the REPL. A quarter, a dime, a nickel and a penny add
up to 41 cents, so this should be false:
demo.coins=> (can-afford? [:quarter :dime :nickel :penny] 45)
true
It says true. Something's off. Pop open the Sayid workspace with C-c s w
(sayid-tree-view-workspace):
 Sayid workspace   n/p: move   TAB: expand   RET/.: visit   q: quit
▾ (demo.coins/can-afford? [:quarter :dime :nickel :penny] 45) => true
    (demo.coins/total-cents [:quarter :dime :nickel :penny]) => 45
Every traced call is a foldable node, with its arguments and return value inline
(TAB folds a subtree, RET jumps to source). total-cents got our four coins
and returned 45, but four coins worth 41 cents can't total 45. The bug lives
inside total-cents.
This is where Sayid earns its keep. Put your cursor on total-cents and add an
inner trace with C-c s t n (sayid-inner-trace-fn). Clear the log with
C-c s c (sayid-clear-log) so we start fresh, run the call again, and reopen
the workspace:
▾ (demo.coins/can-afford? [:quarter :dime :nickel :penny] 45) => true
  ▾ (demo.coins/total-cents [:quarter :dime :nickel :penny]) => 45
    ▾ (apply + (map coin-values coins)) => 45
        (map coin-values coins) => (25 10 5 5)
An inner trace records the output of every expression inside the function, each
one a node you can fold into. Follow it down to (map coin-values coins): it
turns our coins into (25 10 5 5). There it is. The last value should be 1, not
5 - a penny is worth five cents in our map.
Press RET on that line to jump straight to the source. Fix coin-values so
:penny maps to 1, then reload the Sayid way with C-c s !
(sayid-load-enable-clear): it removes the traces, reloads the buffer,
re-applies the traces and clears the log in one go. Run the call once more:
demo.coins=> (can-afford? [:quarter :dime :nickel :penny] 45)
false
Bug fixed, and we never reached for a single println. That's Sayid.
License
Distributed under the Apache 2.0 License. See LICENSE for details.
Can you improve this documentation? These fine people already did:
Bozhidar Batsov, Bill Piel, J Hacksworth & Andrea CrottiEdit on GitHub
cljdoc builds & hosts documentation for Clojure/Script libraries
| Ctrl+k | Jump to recent docs |
| ← | Move to previous article |
| → | Move to next article |
| Ctrl+/ | Jump to the search field |